How the massive model at LSU’s Center for River Studies works
Sure, we’ve got computers to help us understand and chart the dynamics of a river. But what about seeing a river’s power on a realistic scale, with water and “sediment” flowing down one of the largest models of its kind in the world?
When the LSU Center for River Studies opens on the Water Campus at the end of the year, researchers and visitors alike will get to see 179 miles of the lower Mississippi River from Donaldsonville to the Gulf of Mexico come to life.
The state’s Coastal Protection and Restoration Authority funded the $18 million project inside a 45,500-square-foot facility, and it will be operated by LSU and open for public tours.
“It’s this combination of science and a working laboratory as well as public outreach,” says project manager Rudy Simoneaux. “We’re in the midst of a coastal crisis, and there are some people who don’t think there’s anything being done about it. So we can use this to show people we’ve been busy, we plan to get busier, and here’s why.”
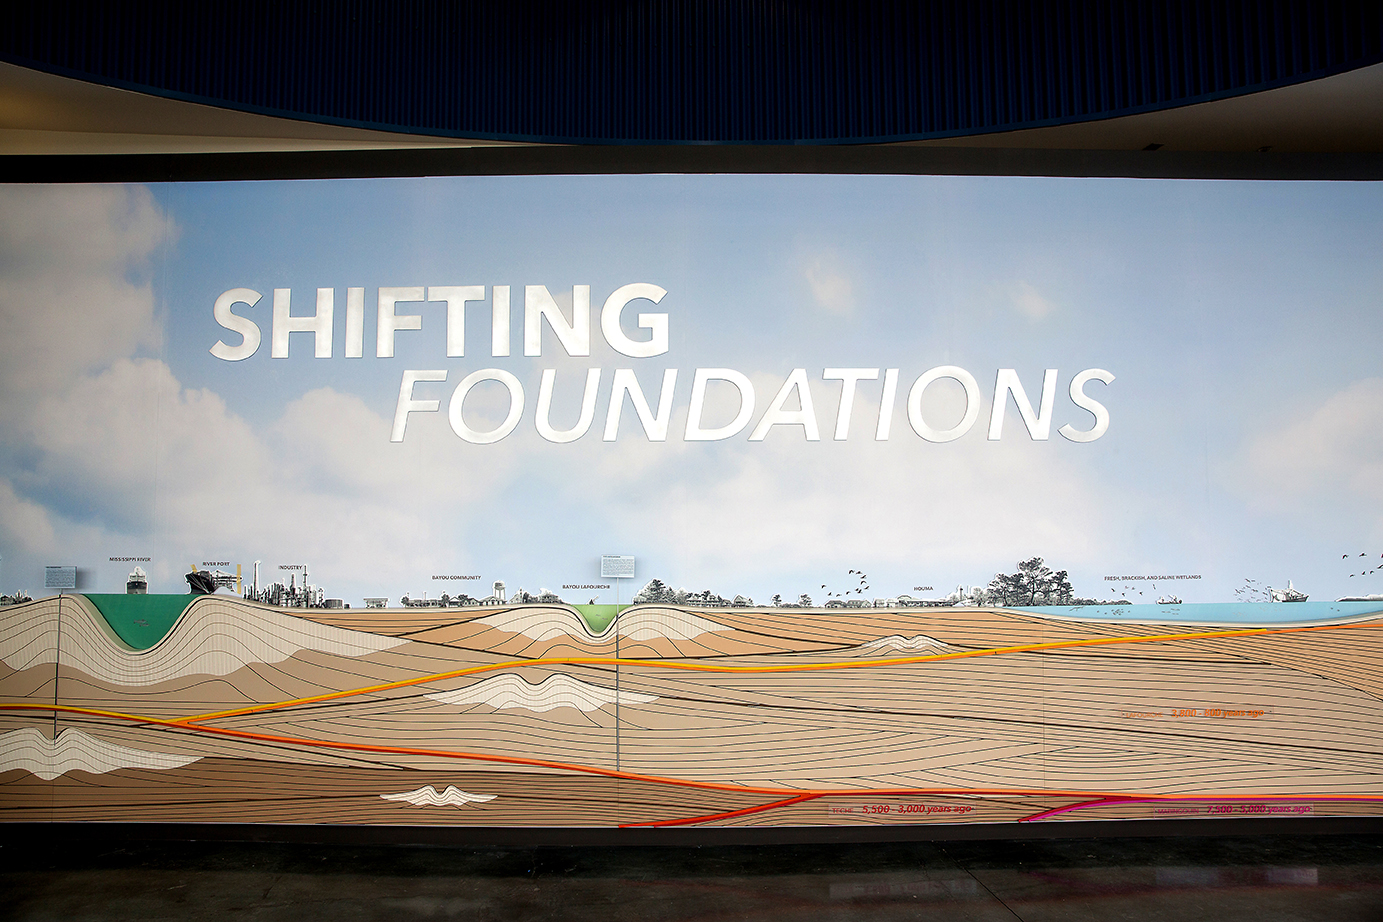
LOUISIANA’S CHANGING COAST
While the model is based on the latest information about Louisiana’s coastal terrain, officials acknowledge it’s an ever-changing landscape. Tests can show where new land is developing, but not necessarily where land is slipping into the Gulf—though they can adjust water levels to match sea level rise. The model itself is made of 216 individual panels, and some can be replaced eventually if there’s a drastic change on the coast.
HOW THE RIVER MODEL HELPS
The state’s Coastal Protection and Restoration Authority is spearheading multiple sediment diversion projects and marshland rebuilding projects at once, with multimillion-dollar price tags—all to protect the vulnerable coastline.
The model can create multiple scenarios, like what happens when the river is high and engineers are forced to open a diversion canal, to see how one scenario might impact multiple projects.
“We try to think of it as three tools: the people out in the field—out collecting data and studying what’s happening to the river—then numerical modeling with computers, and then this physical model. So all three can provide even stronger evidence,” CPRA’s Rudy Simoneaux says.
In an emergency situation, projectors in the ceiling can highlight evacuation routes and flood protection systems on the model to help officials plan a strategy.
With flooding events, CPRA is often tasked with helping to fix levee breaches.
“We have to hit the ground and identify exactly where the problem’s going to be and how to fix it,” Simoneaux says. “So this could be the opportunity of somewhat of a war room to map things out.”
Hover over different area’s of the model to see how it works:

BY THE NUMBERS
14,000: Square miles of Southeast Louisiana covered on the model, including Terrebonne and Barataria bays, the Mississippi delta and Chandeleur Sound.
1 foot = 1 mile: One foot on the model equals roughly a mile of land. The high-density foam used for the model’s surface was carved using billions of data points that chart the terrain of the coast.
1 hour = 1 year: One hour of testing on the model is approximately one year of natural river time. So to test a 50-year scenario of sediment movement along the river and other waterways would require around 50 hours of testing.
Online
coastal.la.gov
lsu.edu/coast
This article was originally published in the November 2017 issue of 225 magazine.